Open Source Web Performance Dashboard
30 April 2015
TL;DR: Today me and Tobias released our new web performance dashboard: three Docker containers that makes it super easy to setup something like this: http://dashboard.sitespeed.io/. Everything is Open Source :)
It's no secret anymore, you need to keep track of your web sites performance. Having a fast site will make your users happy. There's a bunch of web performance monitoring tools out there today: Catchpoint, Keynote and Speedcurve to name a few. They all cost money and that is cool if you are satisfied with what you get.
I love the idea of Open Source, so if I can choose, I use Open Source tools. There's actually one cool Open Source performance monitoring tool available today: speedgun.io by Wesley Hales. You can use it to setup multiple instances of PhantomJS 2 to measure your sites speed from multiple locations. That's nice!
The problem or challenge with the tools is always how you should interpret the data. That is often hard. I think SpeedCurve is doing good, helping you understand what you are measuring (Mark and Steve, I don't have an paid account, maybe you could hook me up with a free one, supporting Open Source blink blink). But with all the tools I miss adding my own metrics and graph them.
Presenting the sitespeed.io dashboard
![]()
Don't be fooled by the cute face, sitespeed.io will be hard on you if your site is slow
First: yes you can add your own metrics and graph them. But before going into details of what you can do lets go through the 20 pages manual on how to install ... wait ... you don't need a manual, you need Docker. Yep that's it :) One of our goals has been to make it super easy to get it up and running. You need three Docker images: One containing Graphite, one with Grafana and one running sitespeed.io.
Up And Running
Start Graphite and Grafana:
sudo docker run -d -p 8080:80 -p 2003:2003 sitespeedio/graphite
sudo docker run -d -p 80:3000 grafana/grafana
Then run sitespeed.io, make it run regular as often as you want to collect metrics using your crontab or what you usuallly use to schedule your jobs.
sudo docker run --privileged --rm sitespeedio/sitespeed.io sitespeed.io -u http://www.example.com -b firefox -n 11 --connection cable --graphiteHost $MY_IPYep that's it. Measuring in the real world, you want to map the data volumes for Graphite and Grafana to make the data stored outside of the continer. You can read all of the nitty gritty in the performance dashboard documentation where you find everything you need.
P.S Do you want to collect data from multiple locations? Just run the sitepeed container and send the data with another Graphite namespace.
The dashboard
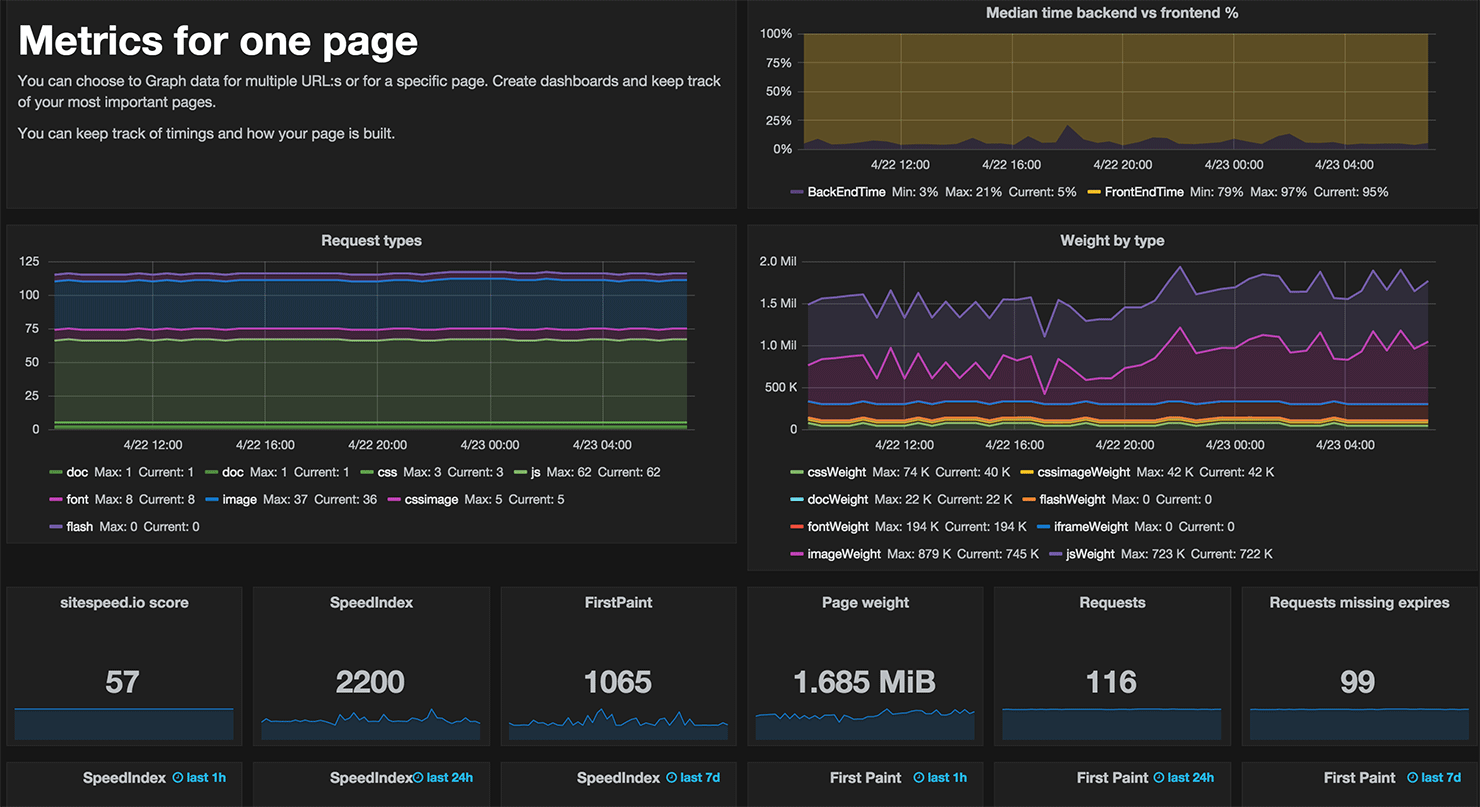
The containers will collect and store your data, and you will need to setup your own graphs. We have created a couple of them at http://dashboard.sitespeed.io/ to show you what you can do. We let sitespeed.io analyze four airlines web sites and graph the stats. Lets see what we can graph (click on the images to go the specific graph).Indeep info about your most important pages
You can graph and keep track how your page is built (things like number of requests, request types and sizes) and how fast your page is using the Navigation Timing and User Timings.
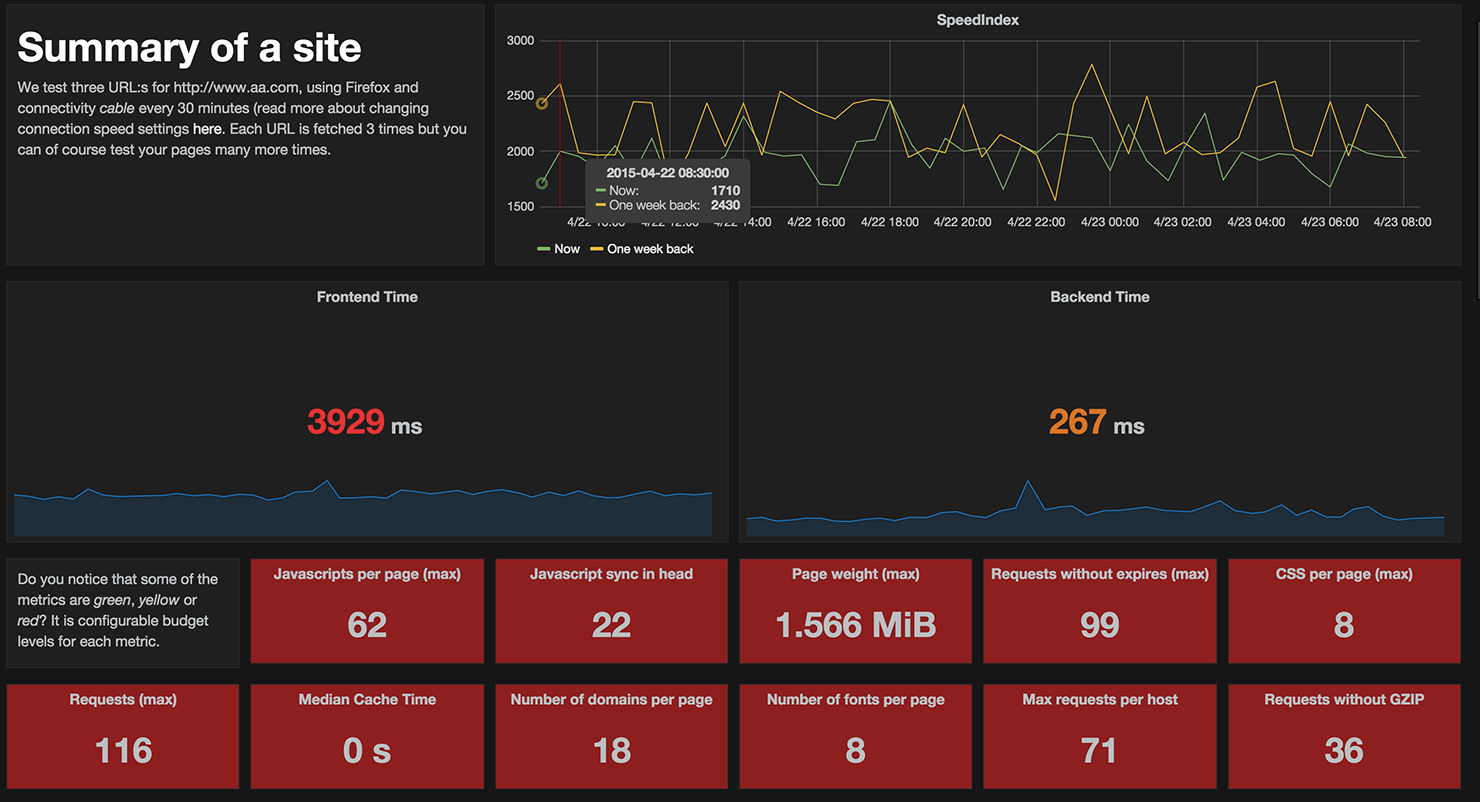
Keep track how your whole site is doing
Summary for a whole site helps you see keep track of all tested pages. Use it to catch pages that are underperforming. And to keep track for your whole site over time. Do you see the red boxes in the image? That is budgets that haven't been met. You can configure budgets for all metrics making it super easy for all users to understand if the site is doing good or bad.
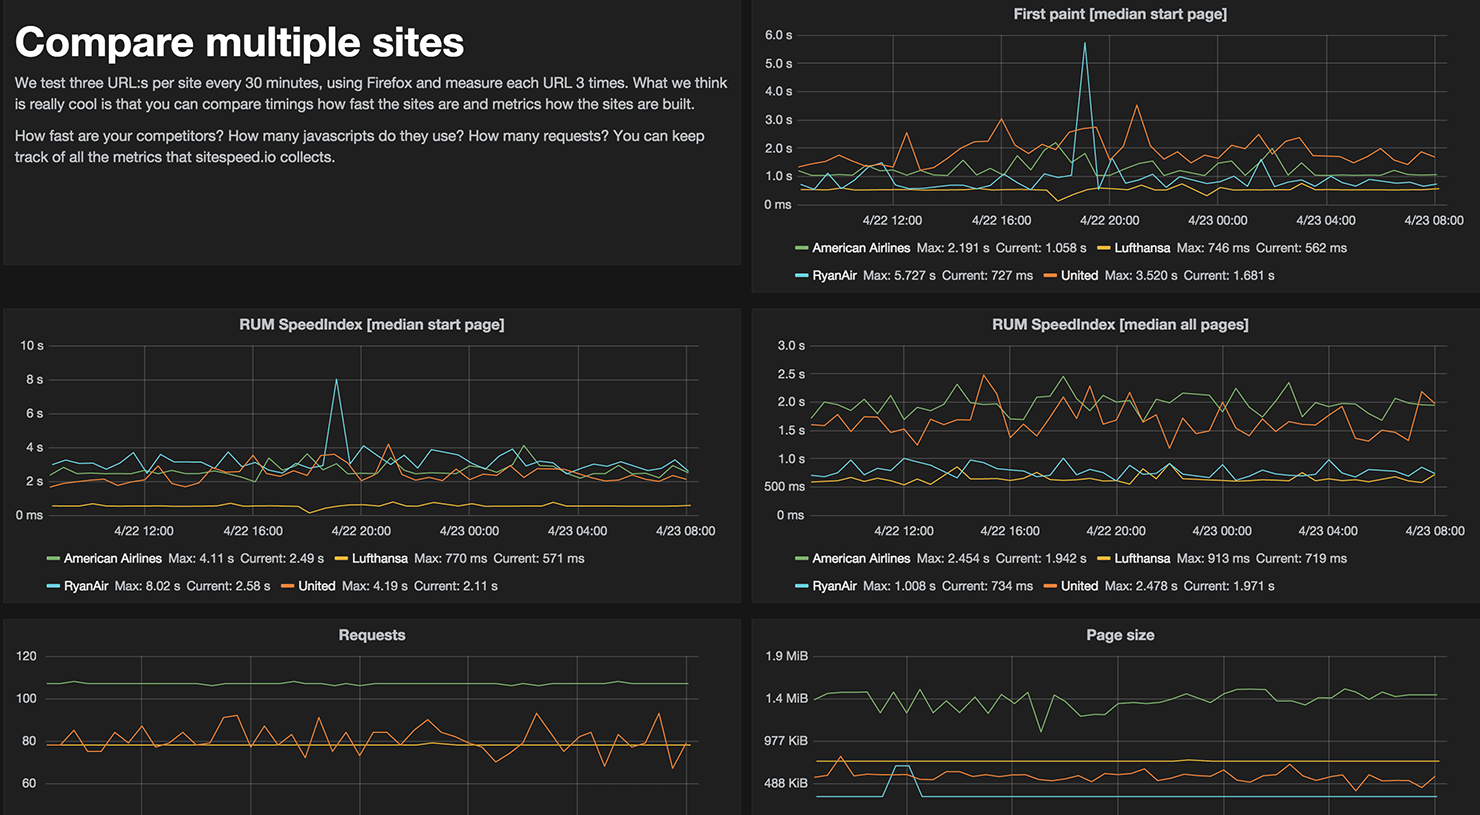
Competition ain't nothing
Compare multiple sites and keep track of them. This is an awesome way to keep track of your competition, how fast they are and how they are building their web sites.
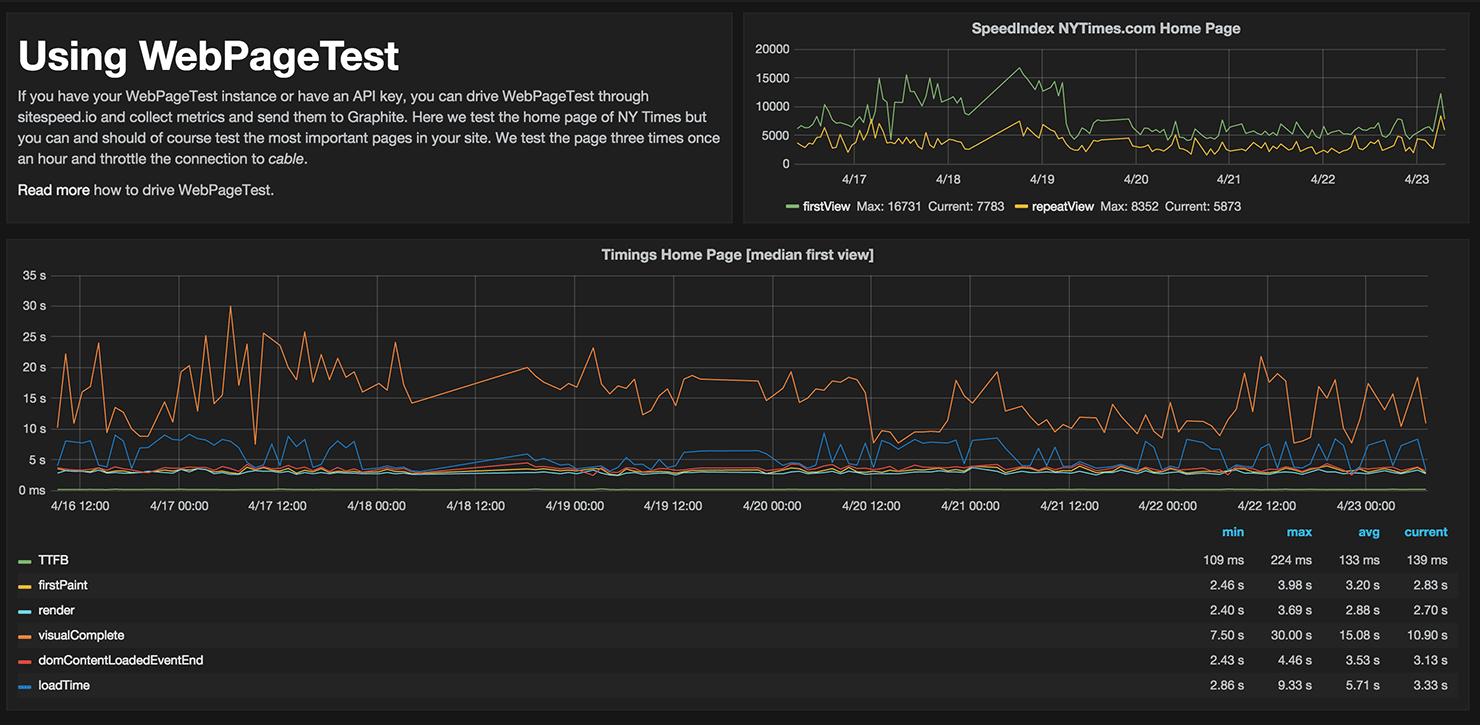
WebPageTest
Yes we love WebPageTest and in this example we drive WebPageTest through sitespeed.io and graph the data. We use the free limited API key provided by Akamai and you should setup your own WebPageTest instance so you can test all your important pages, as often as you need.
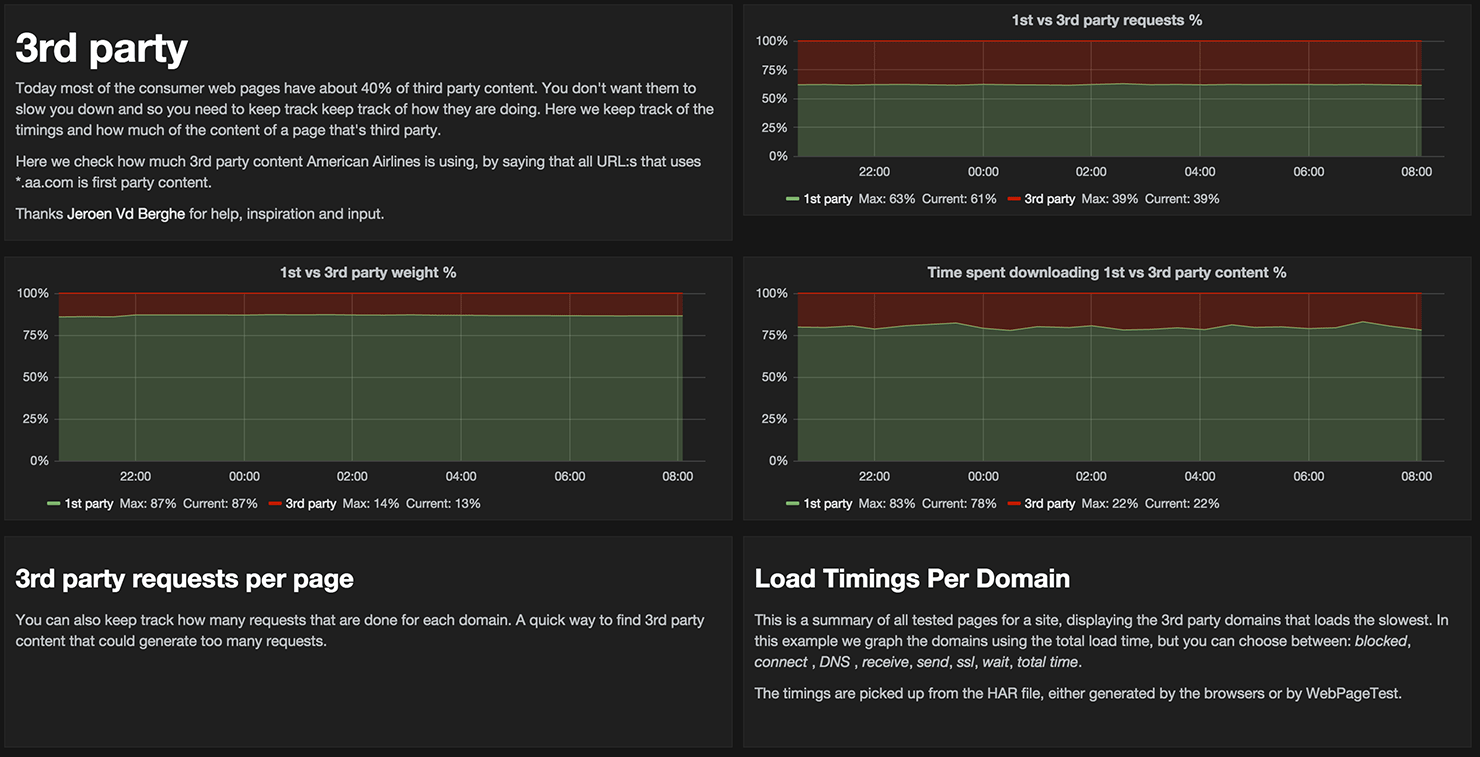
Keep track of your third party content
Today most of the consumer web pages have about 40% of third party content. You don't want them to slow you down and so you need to keep track of how they are doing. Thanks Jeroen Vd Berghe for the help and inspiration with the graphs.
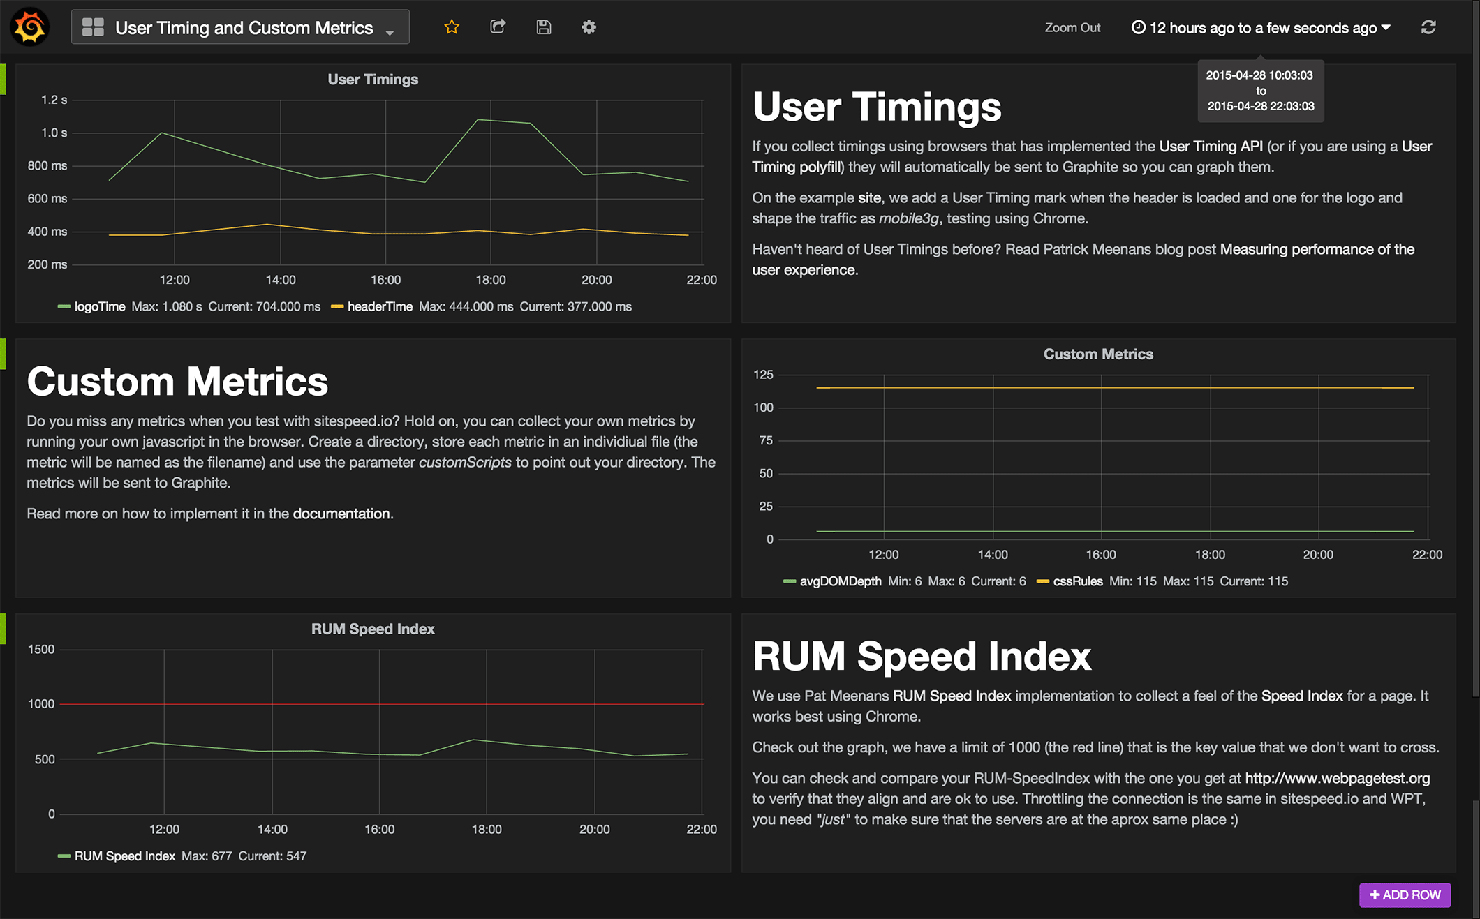
Collect Custom Metrics
Collect your own defined metrics using the User Timing API and running your own Javascript snippets in the browser and the values will automatically be sent to Graphite (both for ach page and a summary for all pages). This is perfect if there's a metric that is super important for your site or if there's a metric that is missing in sitespeed.io. You can add it yourself, as long as you can fetch it using Javascript.
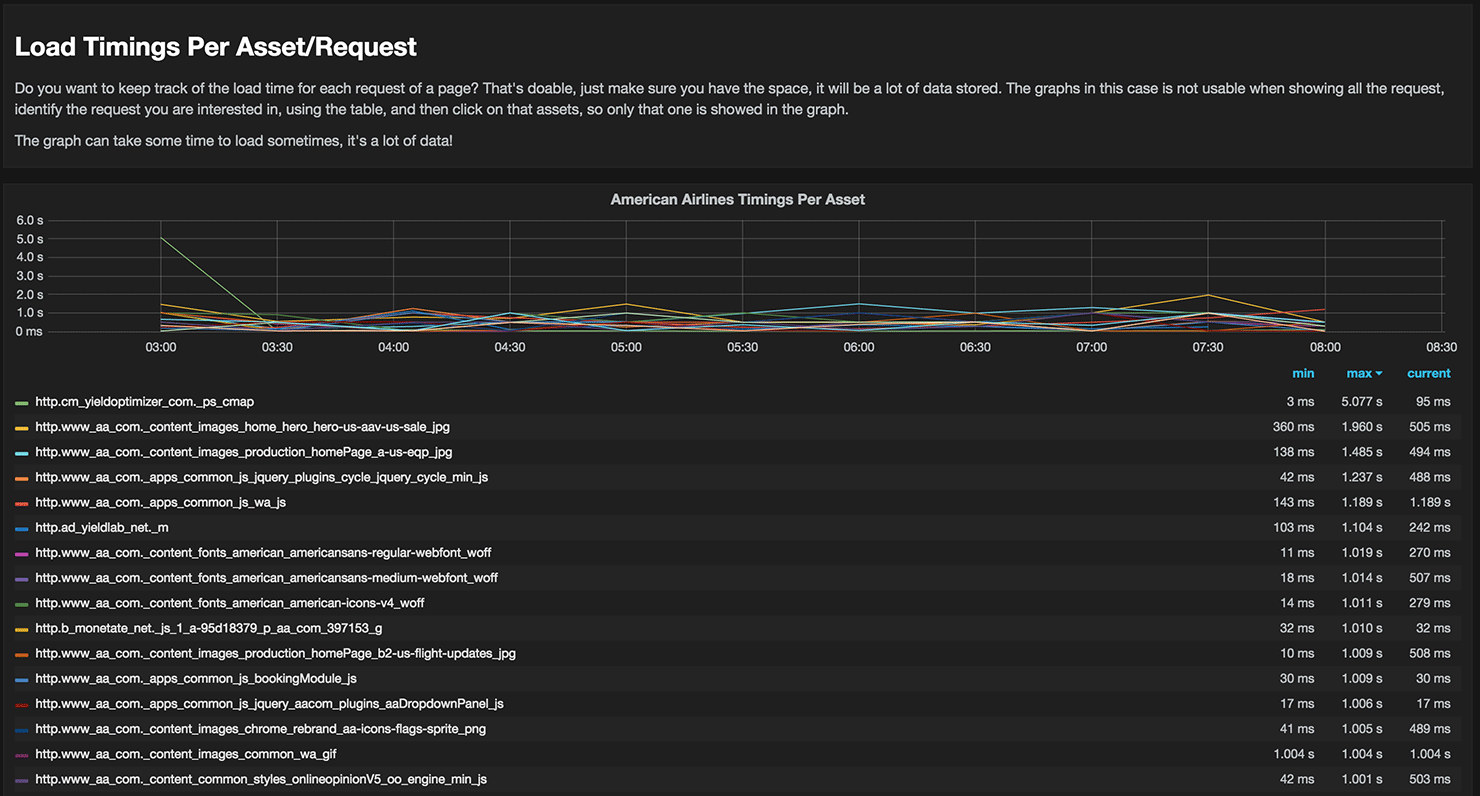
Keep track of every page and every request
This is maybe a little bit crazy but you can collect timings per request You can graph things like time spent in blocked, dns, connect, ssl, send, wait, receive and total time. It will generate a lot of data but is extremely good to find slow loading assets from a 3rd party.
That's all what we have today, but there are more metrics in there and you can do a lot of cool things using Grafana. If you setup cool stuff, please share them with me and I can give you admin access to Grafana so we can show the graphs to all other users. Sharing is caring :)
 Written by: Peter Hedenskog